
BI for incident management
Itransition developed a unified BI solution with wide incident analytics coverage and flexible customization options.
Table of contents
Context
Lloyd’s Register is a global risk management and safety assurance company established in 1760 to improve the safety of ships. The company specializes in classification and compliance, engineering, and technology services for marine and offshore companies. The customer operates in more than 70 locations and serves clients from 182 countries.
The customer has a large ecosystem of software products, but they were missing a service for collecting and analyzing information about incidents. The company envisioned a solution where clients would upload incident data from various sources and receive flexible analytical calculations and visualizations.
Another problem was that the customer has several solutions with similar technology stacks, hosted and deployed independently and utilizing their own database. The solutions’ maintenance and support activities varied, while new feature updates were complicated due to different architectures. Every solution was tailored to each client’s needs and structure for datasets processing, so the customer had to prepare custom templates for different report types and reports processing business logic.
Instead, the customer wanted to create a universal system for all clients that would process and visualize various kinds of reports. Eventually, they decided to combine current solutions into a single scalable system with powerful customization mechanisms to cater to the needs of all clients.
The customer was looking for an experienced technology partner to translate their idea into reality. Having already collaborated with Itransition on several other projects and considering our BI advisory expertise, reinforced by the BI center of excellence and numerous successfully delivered solutions, the customer chose us for the project.
Solution
Overview
Itransition developed a unified scalable BI solution, easily customizable by any client via a user interface. We expanded and improved the functionality of the previous solutions and added new features. This flexible approach allowed us to eliminate limitations on report types, with each given company using relevant templates. The solution’s functionality can also be expanded and modified as business needs change.
The solution’s users are end clients’ employees who need to prepare and send out analytical reports in a format adopted in their departments and come up with suitable reports configuration. As a web application, the solution also supports adaptive design for tablets and smartphones.
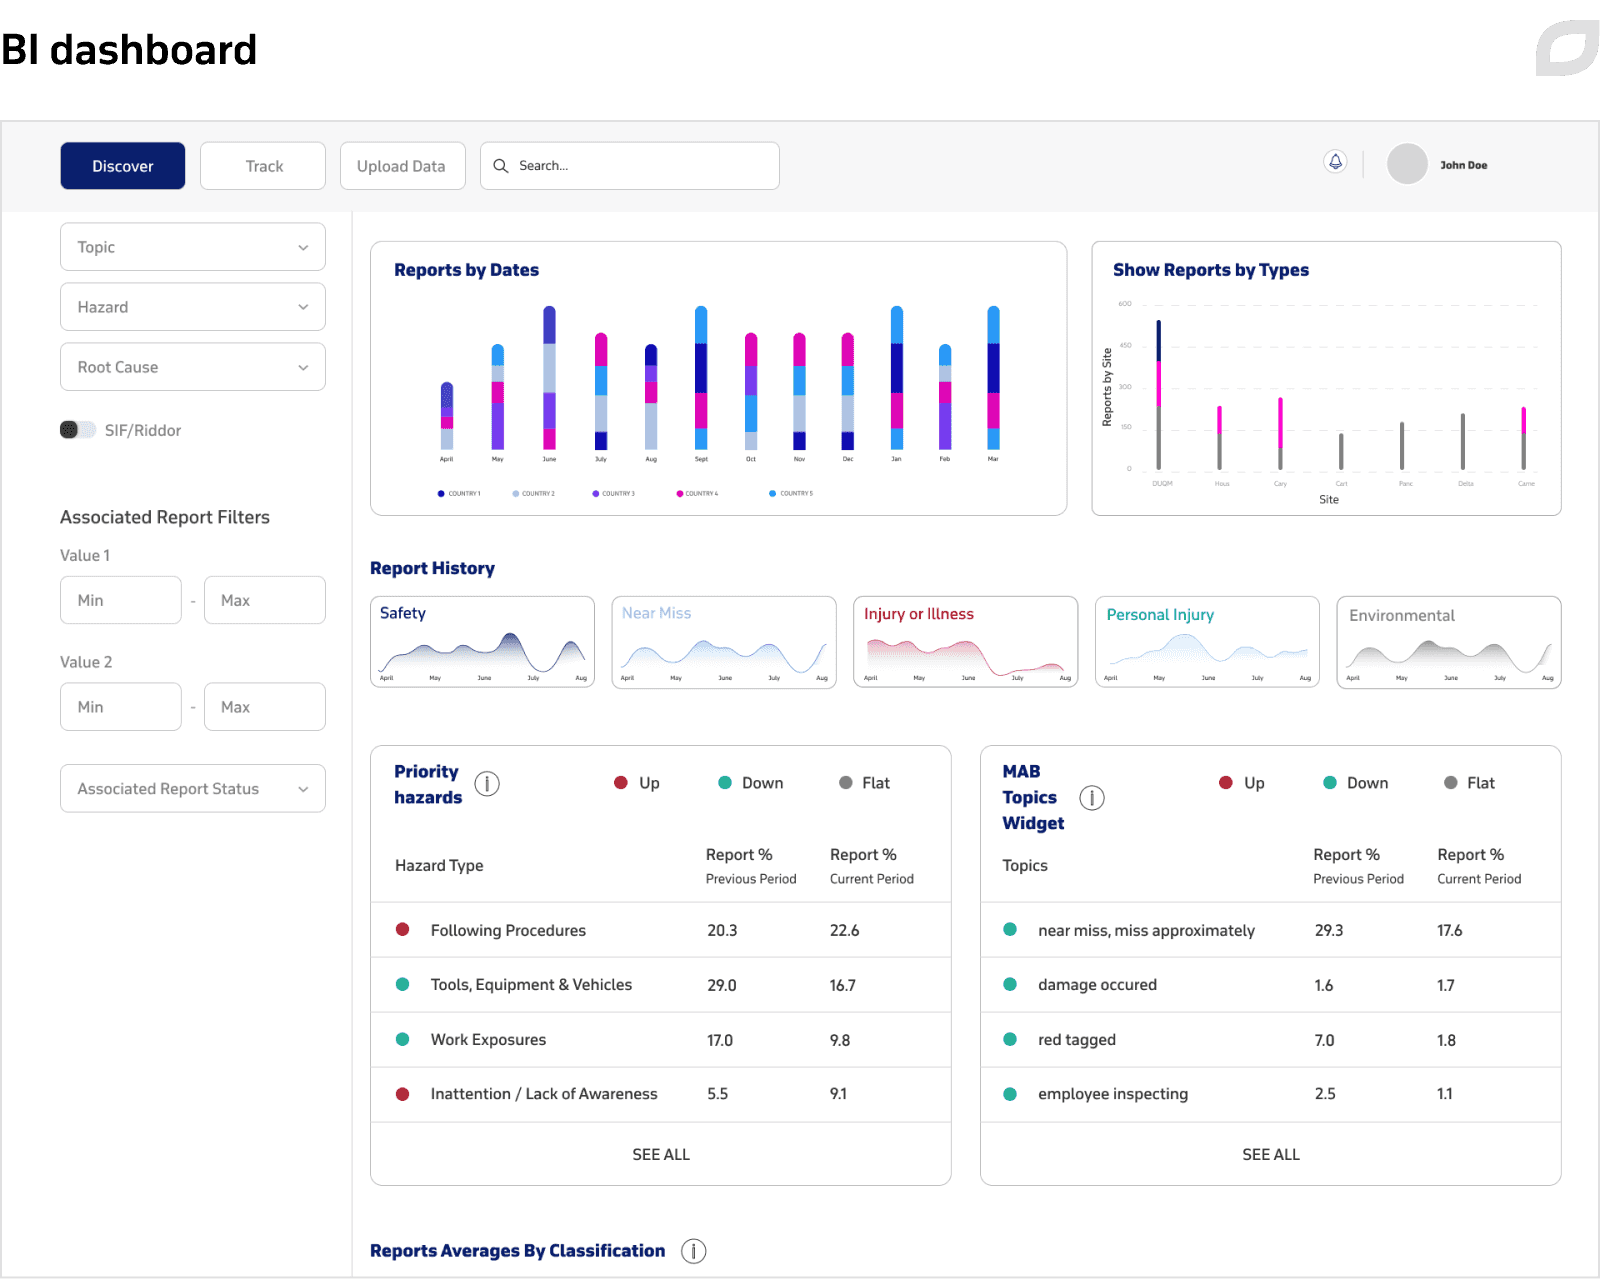
The BI solution consists of:
- Dashboard
It visualizes incident analytics data in the form of graphs, charts, and diagrams and includes a geolocation map with the overall info on each object and associated incidents. Supporting historical data, the dashboard also shows the dynamics for each section. It includes the following features:a set of data visualization widgets preinstalled for each client as per the prior agreement, using terminology specific to their business;
a flexible data filtering system;
personal trackers for monitoring business-specific parameters;
a terminology dictionary.
- Dashboard configuration tool
The tool enables the modification of layout arrangement, element dimensions, widget terms vocabulary, and other elements. - Tool for modular uploading client data
The tool can remember the structure of files for subsequent automatic matching with the customer’s data model in the future.
Data upload and update
The customer’s proprietary data model is an incident classification system that can define the incident’s location, its date and time, and the business department where it happened. It also has an additional set of specific metadata used for determining incident details, like the incident’s type, how it occurred, its geolocation, and so on, with the metadata scope approved by end clients in advance.
The incident classification system has a tree structure, with incidents divided into categories and subcategories. The solution’s algorithms take this structure into account to correctly process and visualize data.
As the previous solutions used different databases, which created some issues, the customer chose Microsoft SQL Server as a database due to its more strict and well-formalized data model. Being table-based, the database is more suitable for predefined schemes and applications that require multi-row operations. Furthermore, it supports foreign keys (the fields that allow for establishing the relationships between two tables) and has a strict set of columns in a table, aligned with the customer’s data clearly defined model scheme.
The database choice also simplified the architecture and reduced the number of dependencies. While transitioning from MongoDB to SQL Server, we also implemented the accompanying architectural backend logic for working with the new database to improve user experience and performance. In fact, since we re-engineered almost all modules and components in the legacy systems, the end solution turned out a completely new one.
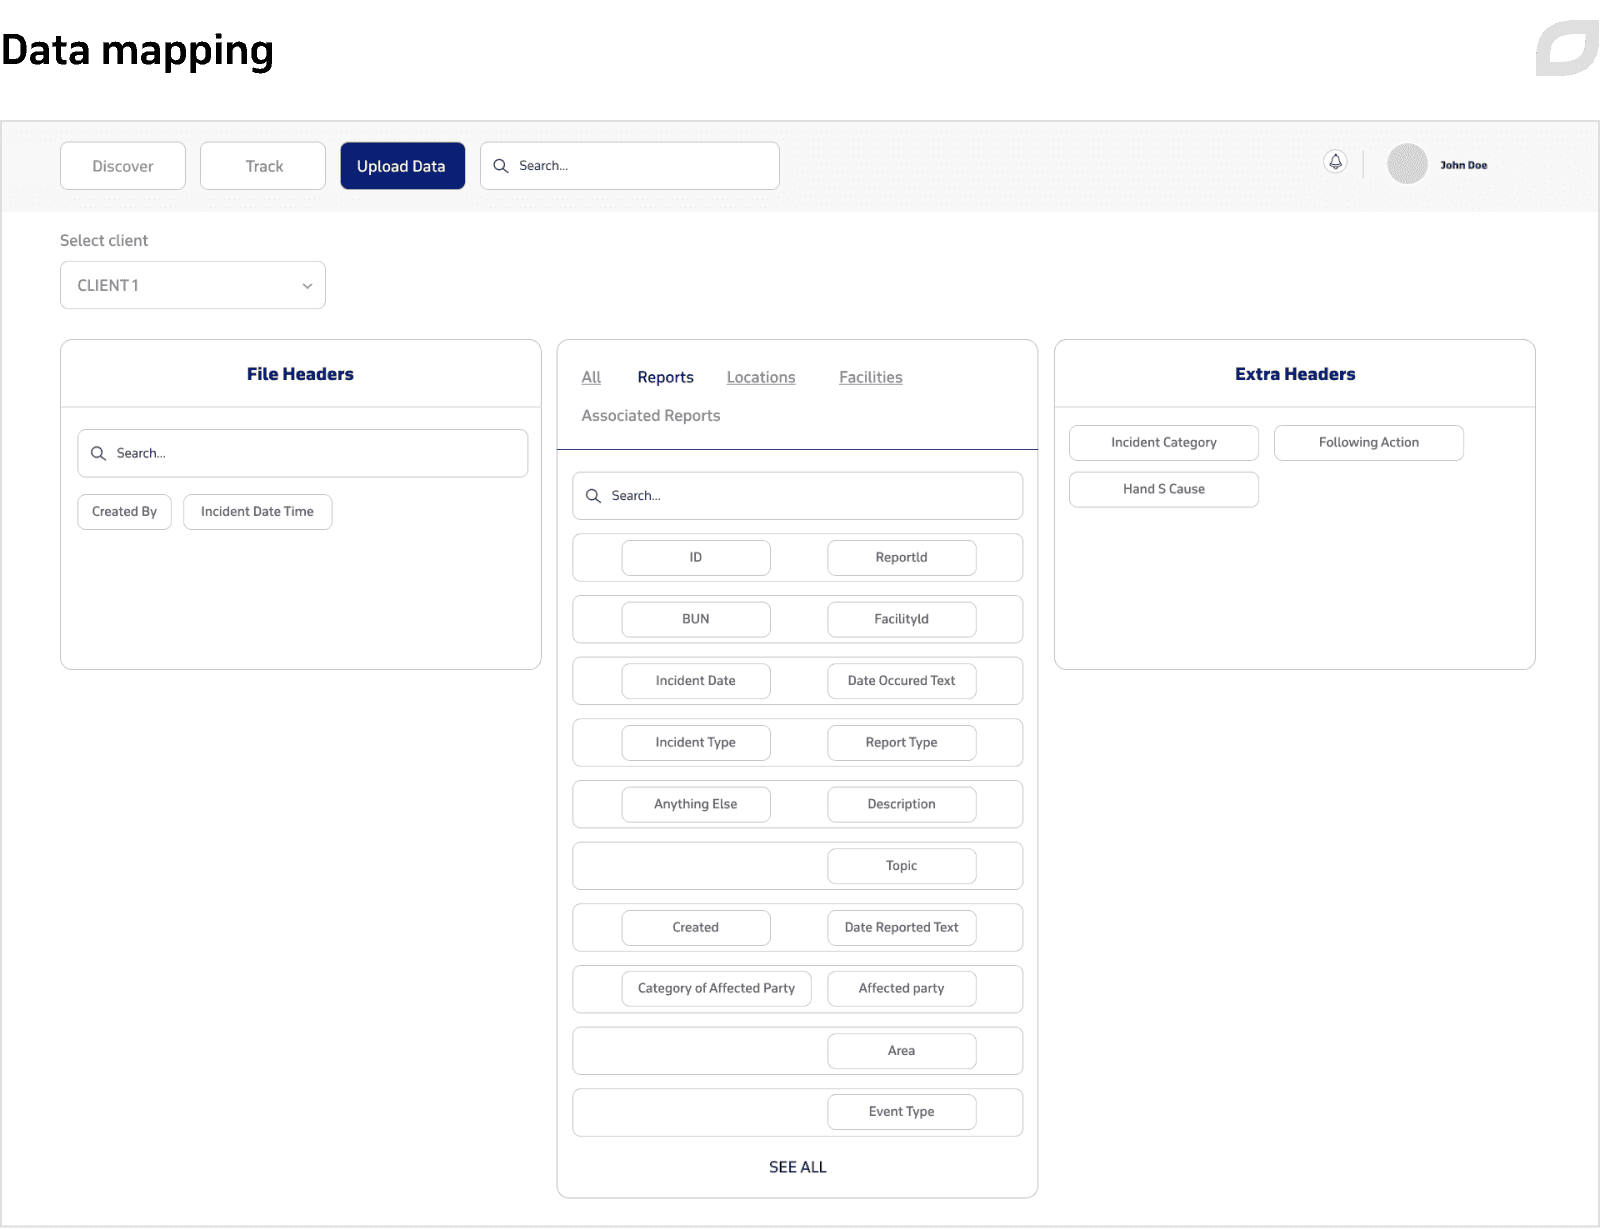
Next, we realized the complex process of multi-step data uploading by system users. The system implies that basic data is uploaded first, followed by the data which can repeat the already submitted information. For instance, a user first defines the business units that can provide reports, and then these business units are subsequently referred to in incident reports. For this purpose, we developed a tool for data uploading and template configuration that allows users to add new data types by defining relations and matching the file structure to the customer’s data model entities.
For improved user experience, we implemented a flexible UI solution with drag-and-drop features enabled by the React DnD utility. Users can create templates and save them in the system for further use. Employees can also upload files of the same structure as CSV, XLS, and other formats, with the system accurately recognizing them. The solution supports modular uploads of reports, so clients are not required to upload all kinds of data at once, as each business unit can have only their part of the datasets and would upload them independently from each other. We also realized support for batch data uploads in any quantity and as many times as needed. The data contained in uploaded files is then transformed into widgets, graphs, diagrams, and charts and displayed in the dashboard.
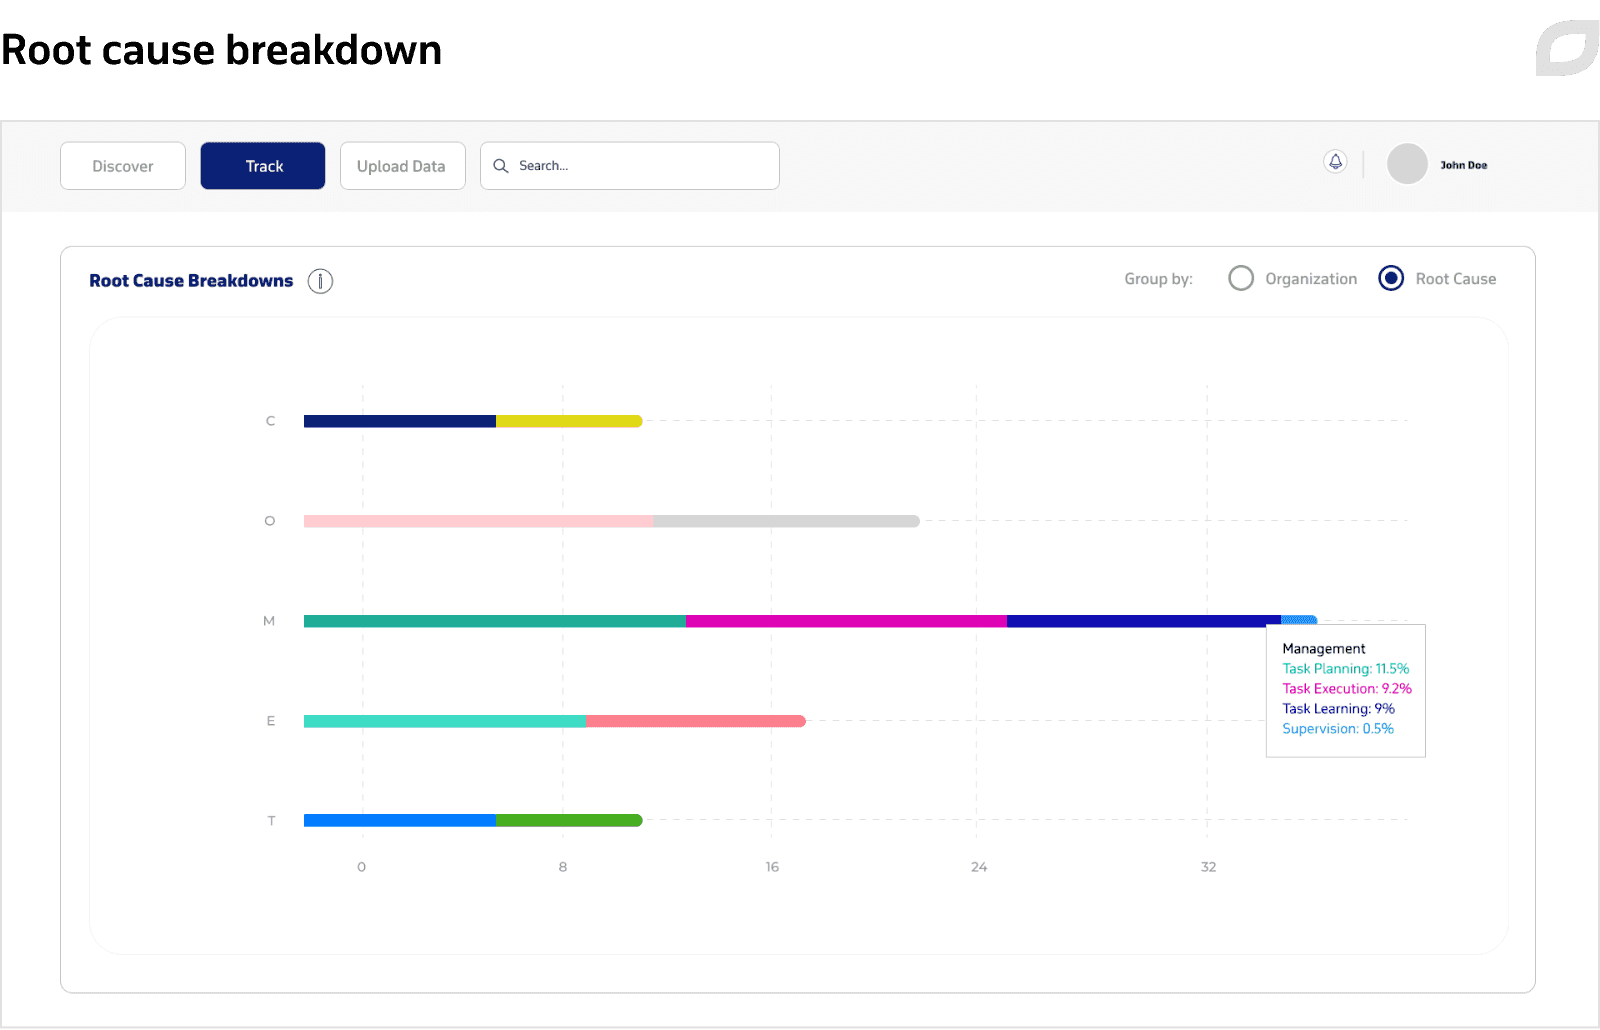
The classification of incidents occurs with the help of natural language processing algorithms on the customer’s side and Azure Machine Learning API. Based on the incident’s text description, the system determines its category, assigns relevant tags to uploaded reports, classifies them, and displays them in final reports. Incidents can be classified into different categories, like their root cause, resulting damage, related topics, and so on.
We also implemented a mechanism for updating and synchronizing uploaded and stored data. To overcome the problem of too many simultaneous requests to the database, we enabled caching of frequently used entities in the solution’s RAM while leveraging search in dictionaries. The solution accesses the database once to obtain existing incident data, compares it utilizing the solution’s RAM, and commits it to the database. Therefore, thousands of commonly used incidents and classification options do not have to be retrieved from the database each time, which minimizes the number of requests and improves performance.
For example, when data is uploaded, the server receives the file and caches the existing incidents from the database into RAM. Next, the entries from the file and the incidents from the cache are matched by a unique entity identifier. Then the system creates a new incident or, if an incident already exists, it just updates some fields. As a result, we managed to reduce data upload time from three minutes to two seconds.
Dashboard and widgets
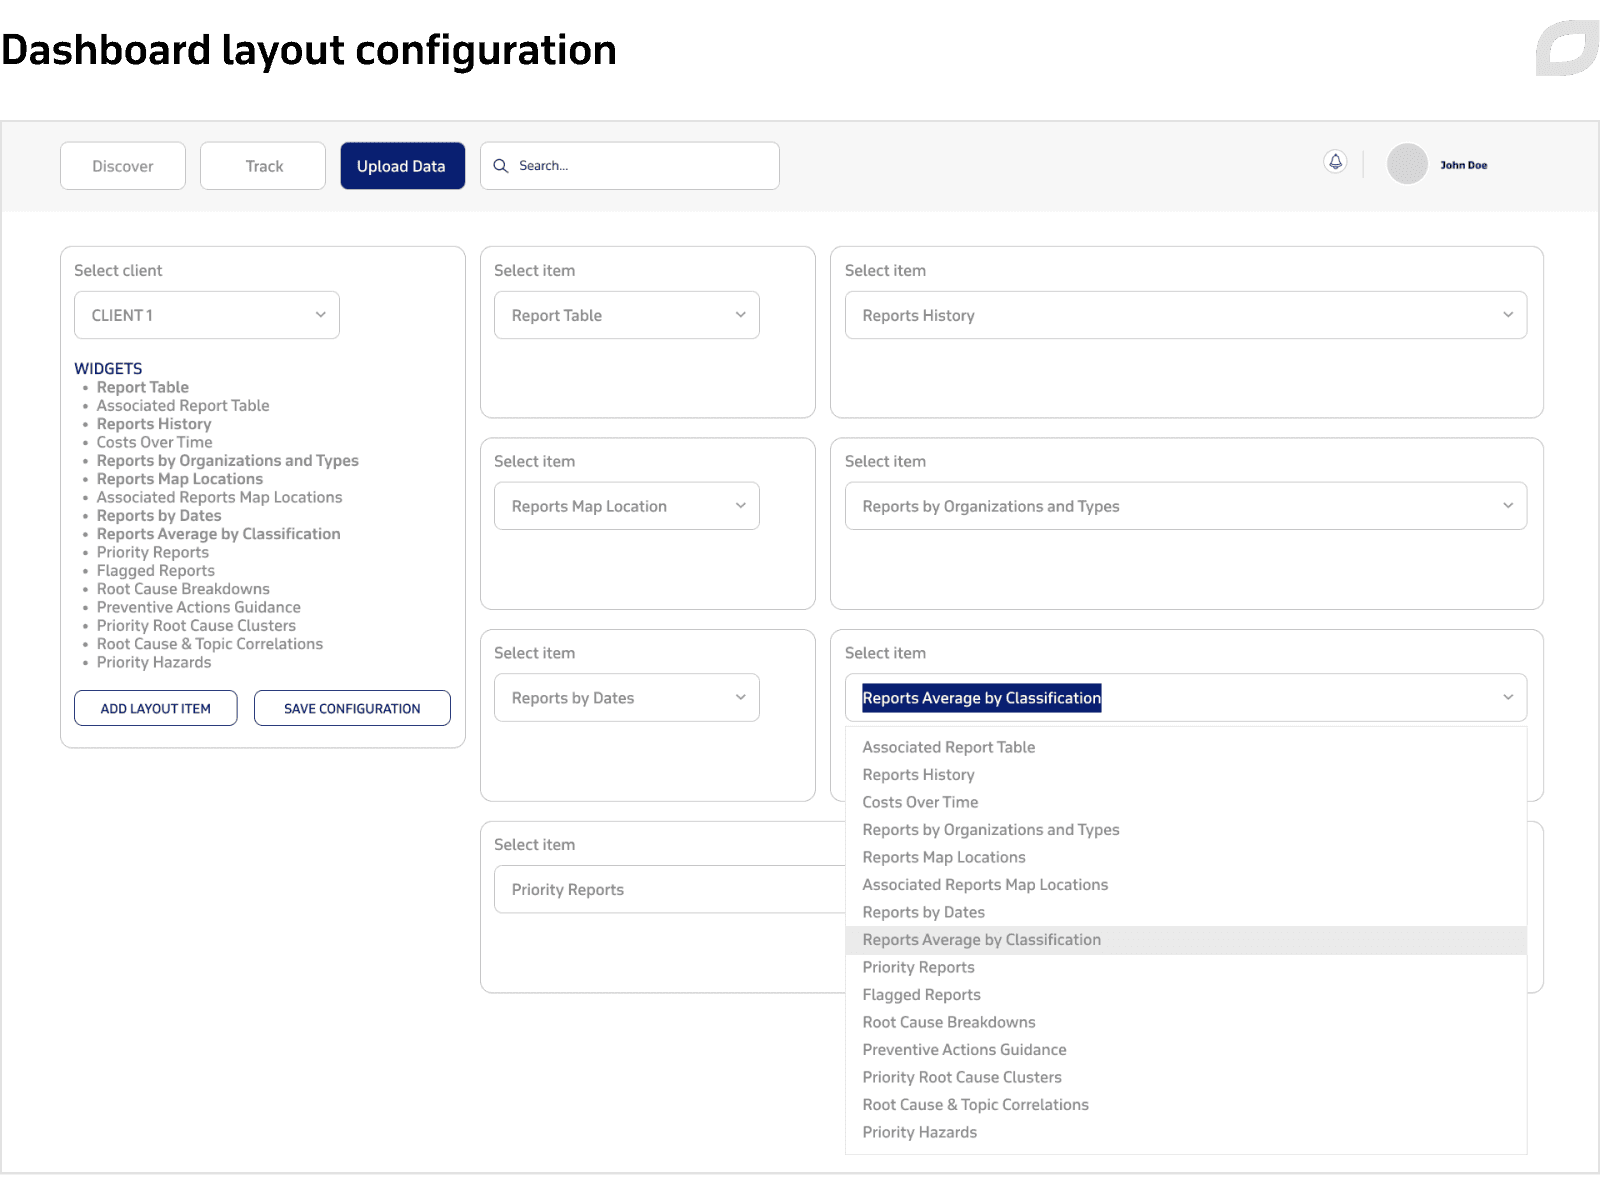
Next, we developed the dashboard with widgets as the main application page. Clients can view only essential widgets and configure them by size, arrange and reposition them to their liking, and use terminology specific to their company. We delivered a customized dashboard, where the customer’s admins can change the following:
- configure the set of widgets and their arrangement
- modify widget size, text information, and titles depending on a corporate client
- add and remove columns in classification tables
Our team also developed the ability to create and edit dashboard configurations. Additionally, we integrated the solution with Google translate to automatically translate the uploaded text with pre-configured parameters.
Moreover, we improved the existing widgets for legacy solutions. Previously, to visualize data, each widget performed a series of data transformations to display reports in a widget-compatible view. However, due to excessive and complex data calculation algorithms, these transformations were cumbersome and redundant and contained unnecessary cycles and groupings, data processing could sometimes take a lot of time. We rewrote the logic of these transformations and implemented less complex and more efficient algorithms.
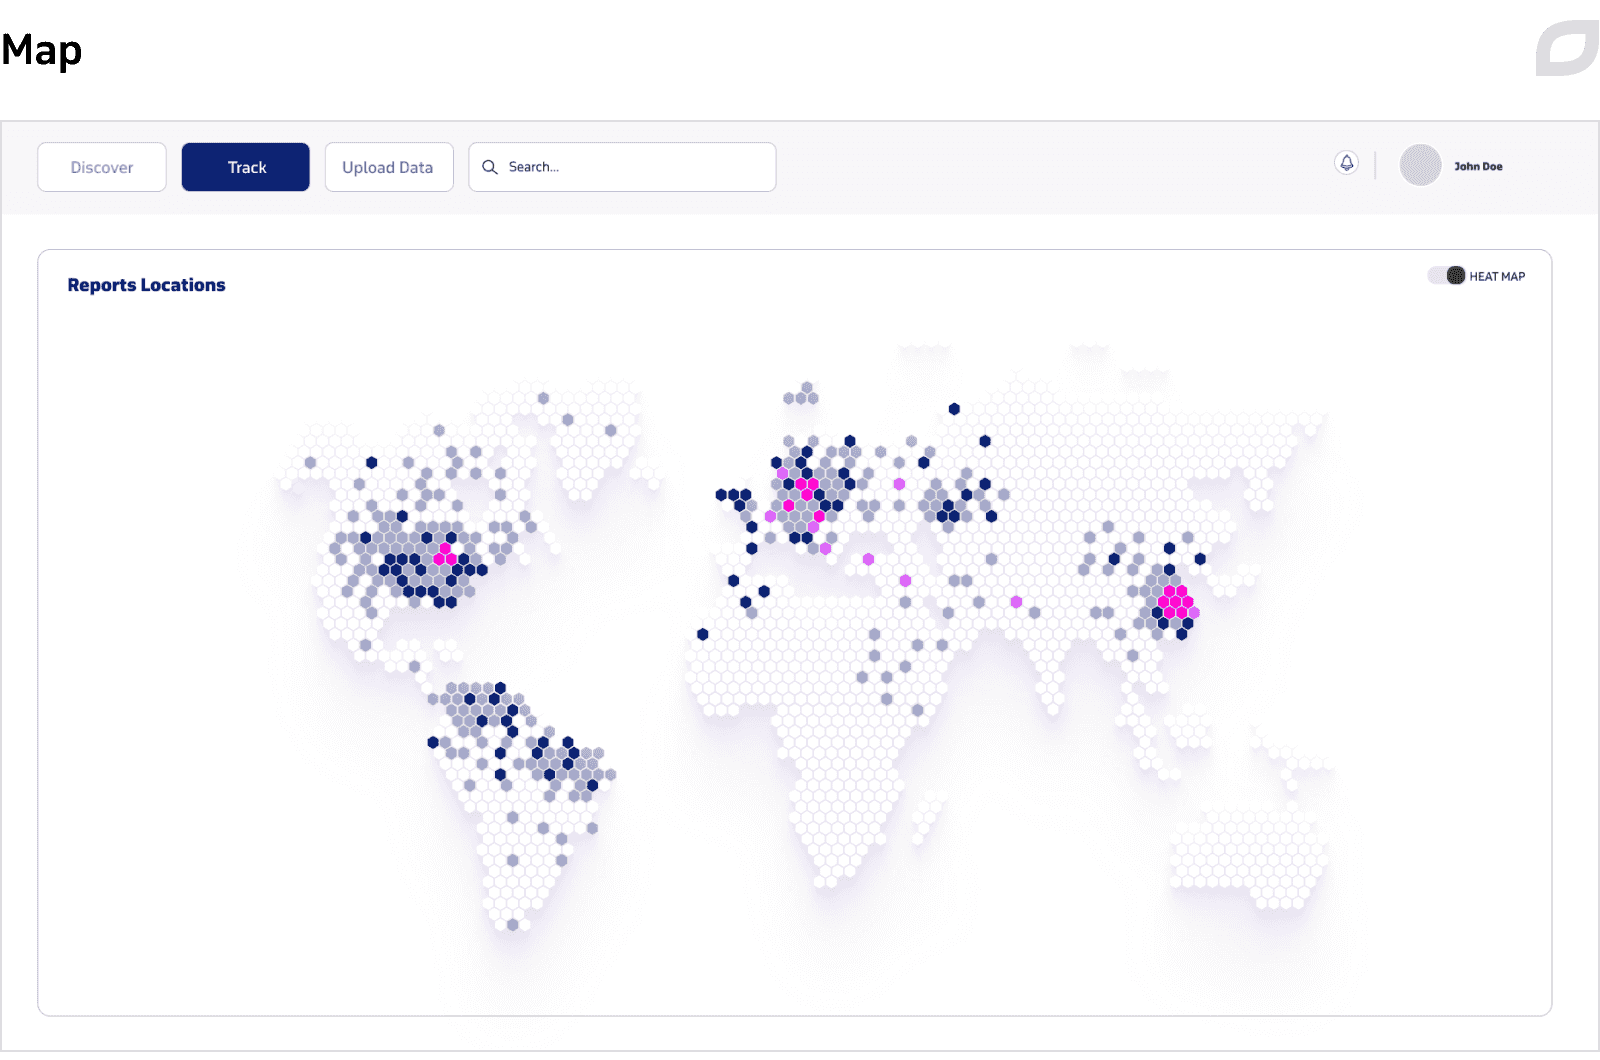
Besides, we significantly improved the map widget, adding points that users can click and view all the information about a specific object and related incident reports. Compared to the previous version, we made it resizable and, by adding dynamically changing color highlighting, allowed users to view activities in the given region. The solution now also supports the display of historical data depending on the date, incident types, and more.
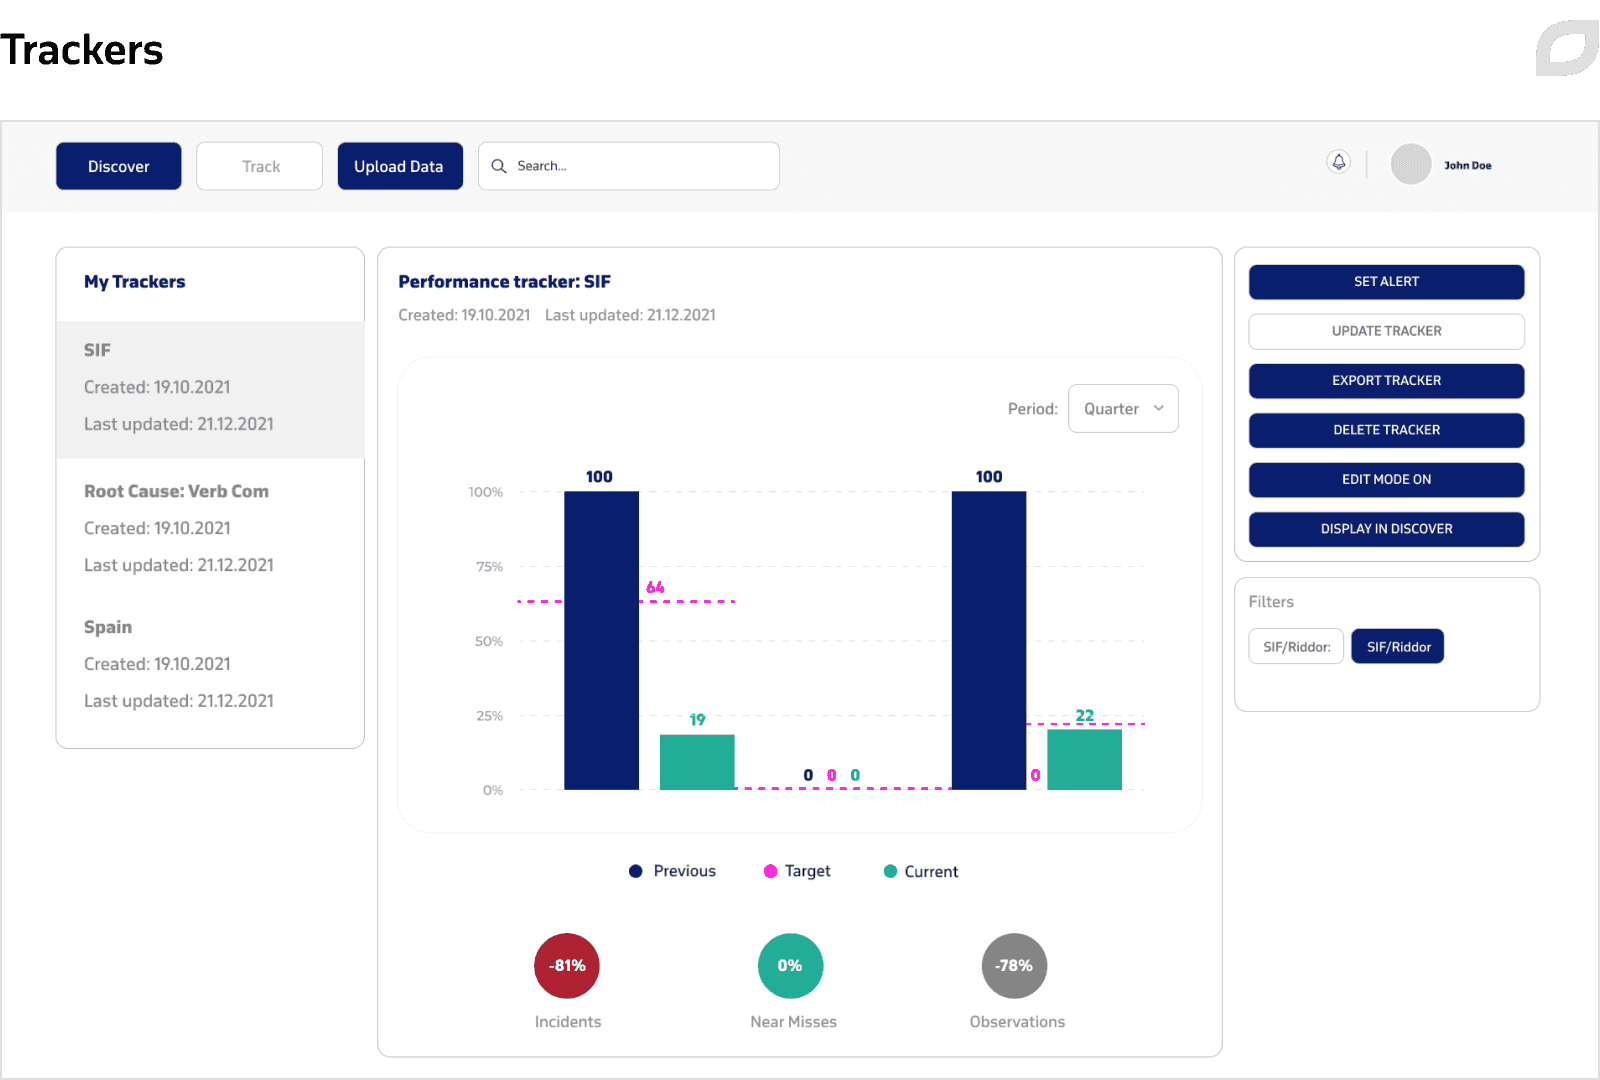
Apart from that, we added a tool for creating trackers, associated with a specific group of incidents and giving a detailed summary of selected parameters. If the client does not want to view all data and prefers working with a particular segment, they can configure certain parameters in the filtering panel and create one or several trackers. This allows users to see incident dynamics in a certain section and define values to be tracked. When the defined values are reached or exceeded, the system notifies the user. The forecasting feature visualizes trends using a trend calculation algorithm.
Process
Having a general vision of the solution, the customer expected our team to actively participate in its ideation and development, so we had leeway to choose tools and implementation methods. From time to time, we also turned to the customer’s senior developer responsible for creating the previous apps for code review and advice.
On the project, we practiced the Scrum methodology and also held daily meetings with the customer to keep them up to date about our progress. We also conducted frequent demos for synchronization and discussion.
Technologies
|
ASP.NET Core The solution’s backend |
React The solution’s frontend |
Microsoft SQL Server Database |
|
ORM Entity Framework Core To simplify working with the database |
MUI library The solution’s UI |
Recharts library Charts creatio |
|
OpenLayers library Interactive maps |
Hosting |
Azure DevOps Task management, CI/CD, and version control |
|
Azure App Service Web application hosting |
SQL Server App data storage |
WebJobs service Notifications about tracker status change |
|
Azure Application Insights Performance monitoring and logging |
Azure Machine Learning Incident classification |
Azure storage account Contains uploaded incident files by users, enables the creation of input data for Machine Learning API, and stores its output data |
|
ARM templates The solution’s and related resources’ deployment |
Google Maps API integration Geolocation |
Google Translate integration Automated translation |
Results
The delivered unified BI solution has wide incident analytics coverage around the globe. It enabled the customer to increase the existing clients’ satisfaction by addressing the need for flexibility and scalability while enabling easy maintenance, support, and update. Shortly after the solution’s launch, the customer managed to attract a new large corporate client, with several other potential customers expressing interest.

Services
Logistics software development
Explore Itransition’s range of logistics software development services, along with top solutions, technologies, and implementation guidelines.

Services
BI services & solutions
Itransition provides end-to-end BI services, enabling companies to unlock valuable insights from their data and make informed, smarter business decisions.

Case study
Robotic process automation for a global logistics company
Learn how Itransition automated three labor-intensive logistics processes using robotic process automation, improving the company's operational efficiency.

Case study
Atlassian migration for IATA
Find out how Itransition implemented Jira Service Desk Cloud and migrated legacy data to it for IATA, an aerospace trade association.

Case study
On-demand truck sharing solution
PayLoader automates the whole transportation process from an order placement to payment processing and client reviews management.

Case study
Shipping automation software migration to the cloud
Read our case study of migrating an international provider’s legacy shipping automation software to the cloud, helping them enter the SaaS market.