
Power BI implementation and training
Itransition developed a Power BI-based tool for an analytics and research consulting company to speed up project delivery twice and provided employee training.
Context
Our customer is a US-based analytics and research consulting firm helping clients develop growth strategies and boost their marketing effectiveness. During their 20+ years in business, they have provided market research services by studying ads performance and viewer preferences, analyzing cultural insights, monitoring brand popularity, and more. The customer has completed several hundred projects and their client base counts around 300 leading brands across different domains, including pharmaceuticals, technology, food and beverages, etc.
The customer had stored their clients’ data in CSV files and processed it using the R script. As a result, they got Excel files with thousands of rows of data, which the company employees used to prepare reports and create PowerPoint presentations.
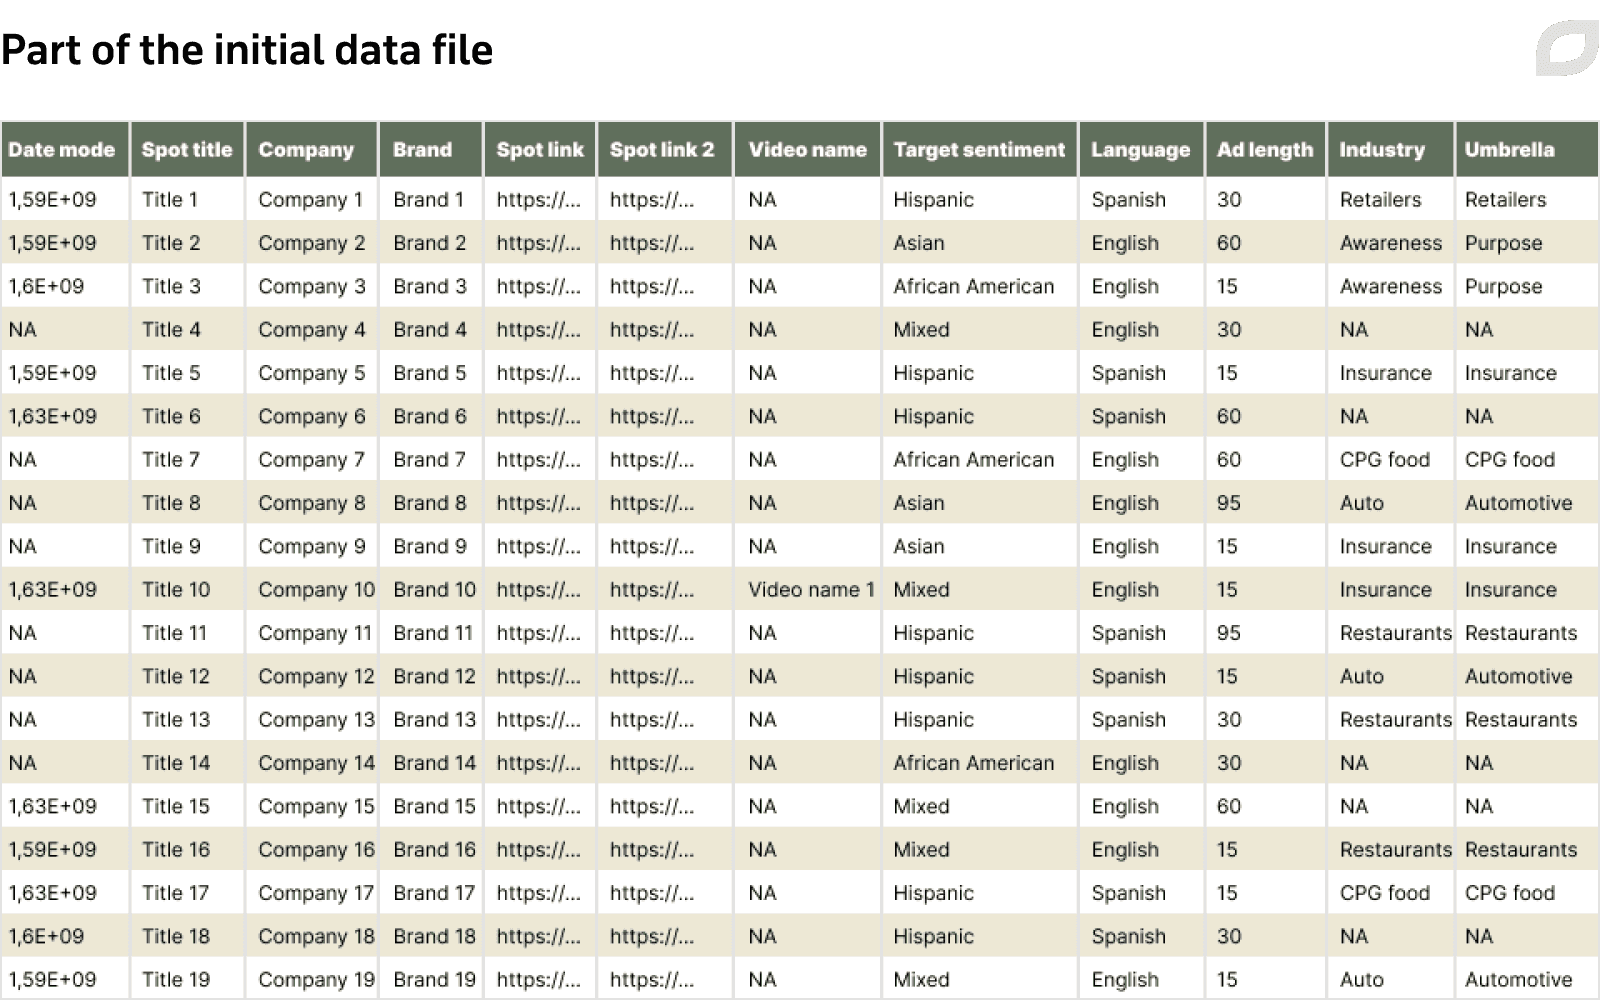
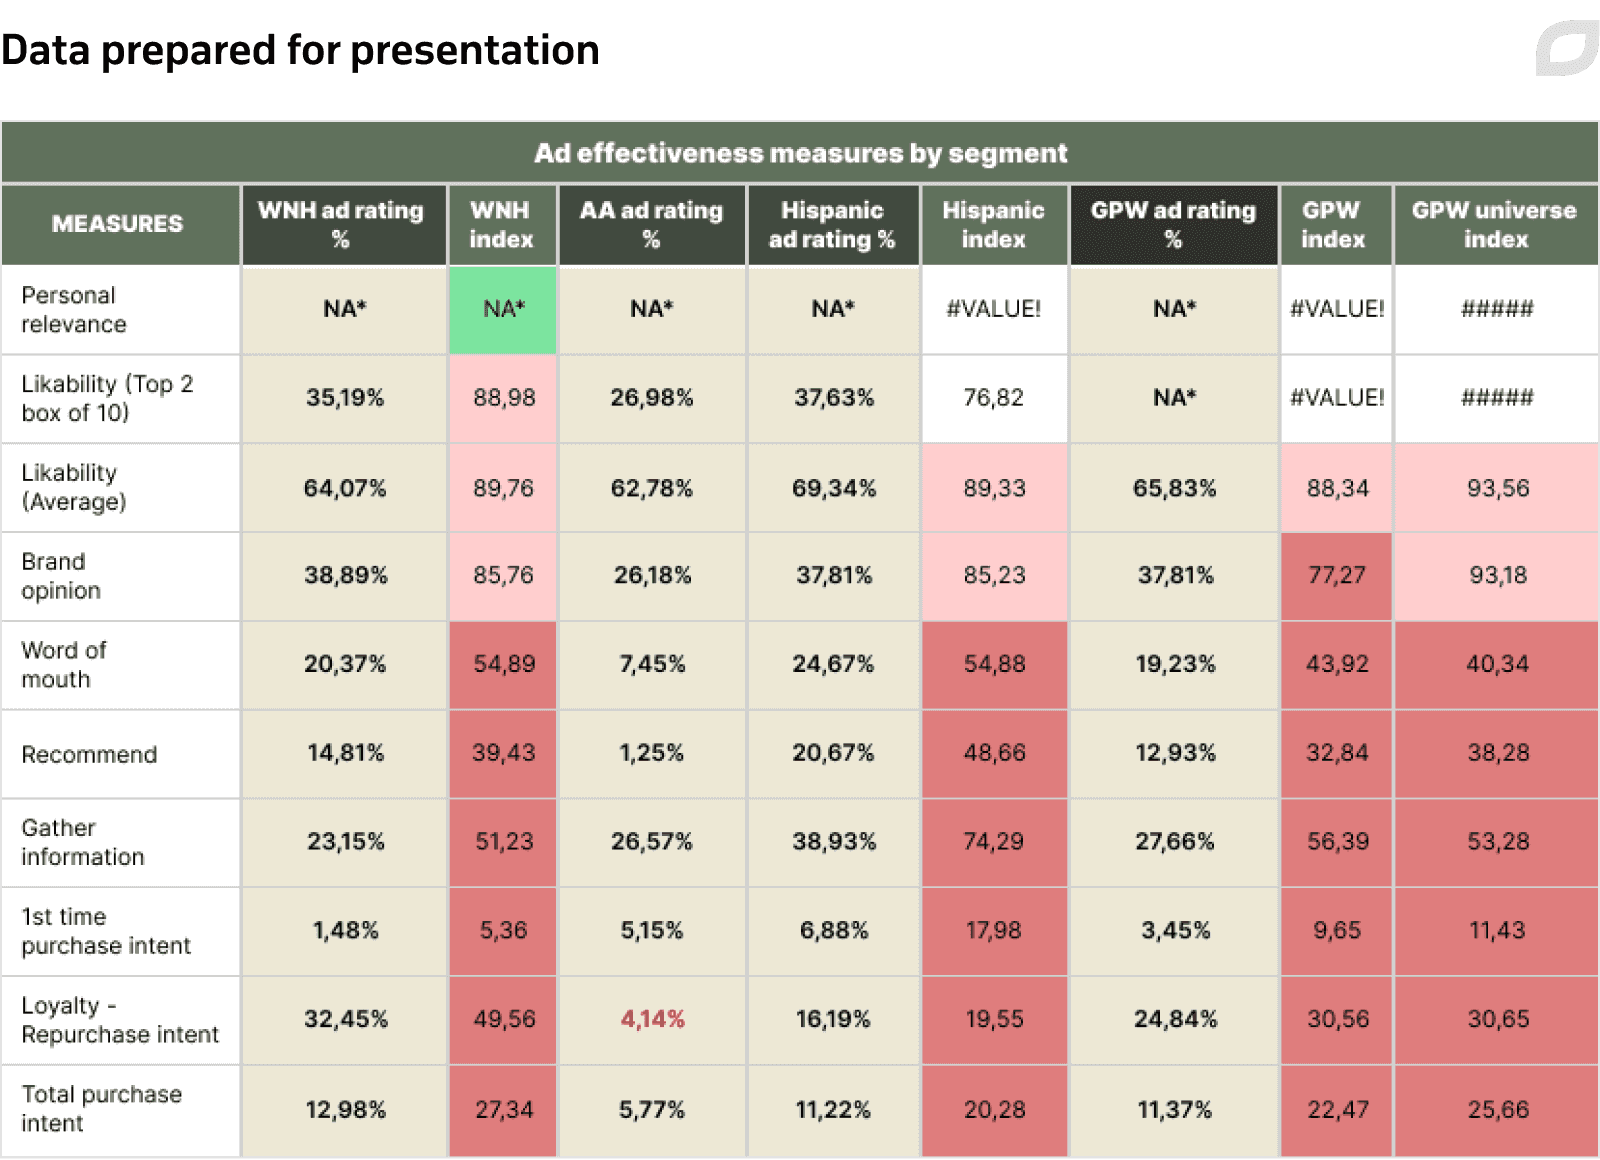
The gathering of data on ads performance and cultural insights, its analysis, and presentation preparation took up to a person-week each month. In addition to being time and effort-consuming, the process involved a risk of human errors. That is why the customer wanted to introduce a comprehensive BI tool to make their data analytics and reporting capabilities more efficient.
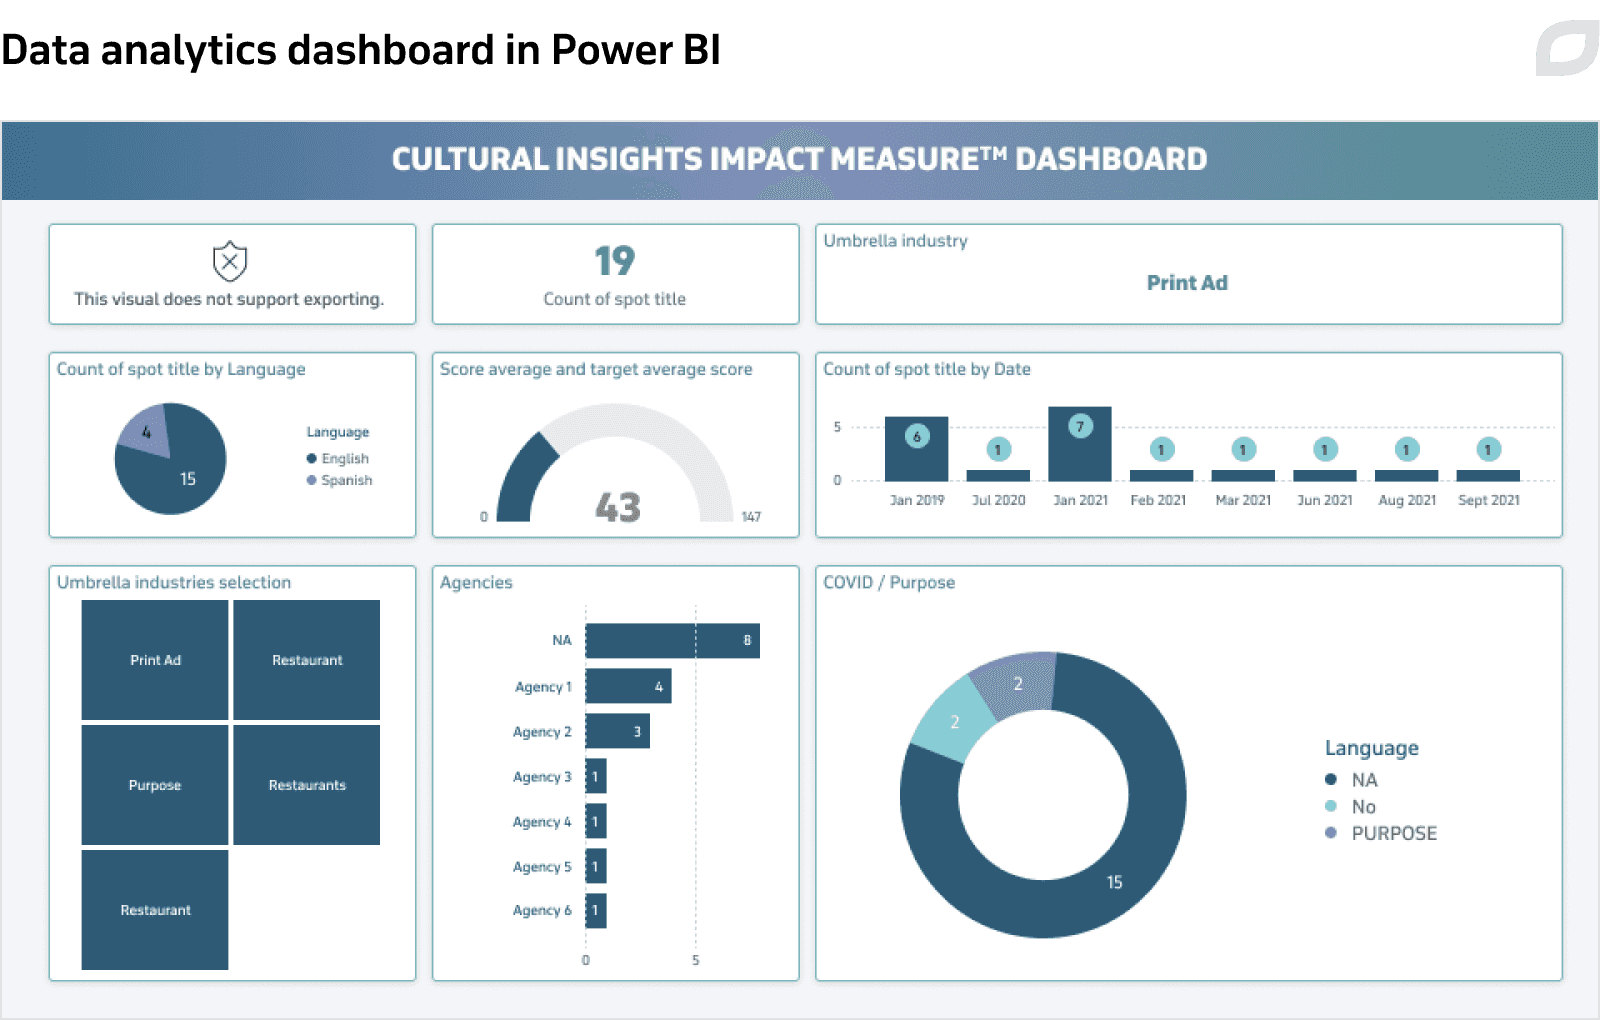
The customer wanted to have a dashboard where one could get summary metrics for a particular ad and, if needed, see other ads’ performance easily and quickly. The BI tool should also allow for viewing interactive reports in a digestible form and working with multiple related data inputs at once.
The customer was searching for a consulting company that would help them find a tool for their needs and integrate it into their processes. Having investigated several options, they turned to Itransition thanks to our expertise in delivering BI advisory and tools.
Solution
Within the course of the project, Itransition investigated the customer’s business case and requirements, suggested using Power BI, designed and implemented complex Power BI reports optimized for exporting to PowerPoint and PDF, and conducted training sessions.
Investigation
Itransition studied the customer’s requirements and complex questionnaire data sources. Based on the customer’s needs and business specifics, we developed a detailed proposal, a high-level solution architecture, and a beta version of a Power BI analytics dashboard and demoed it to the customer. As they approved the suggested solution, our team proceeded with developing a Power BI tool.
Power BI implementation
Itransition designed the process of transferring the data from CSV files to Power BI. The customer gets the data from their clients and stores it in a SharePoint folder, updated by the customer as needed. We connected Power BI to the SharePoint folder, so once a day, Power BI queries the folder, loads the source data into a dataset, and updates reports, making sure that they are up-to-date.
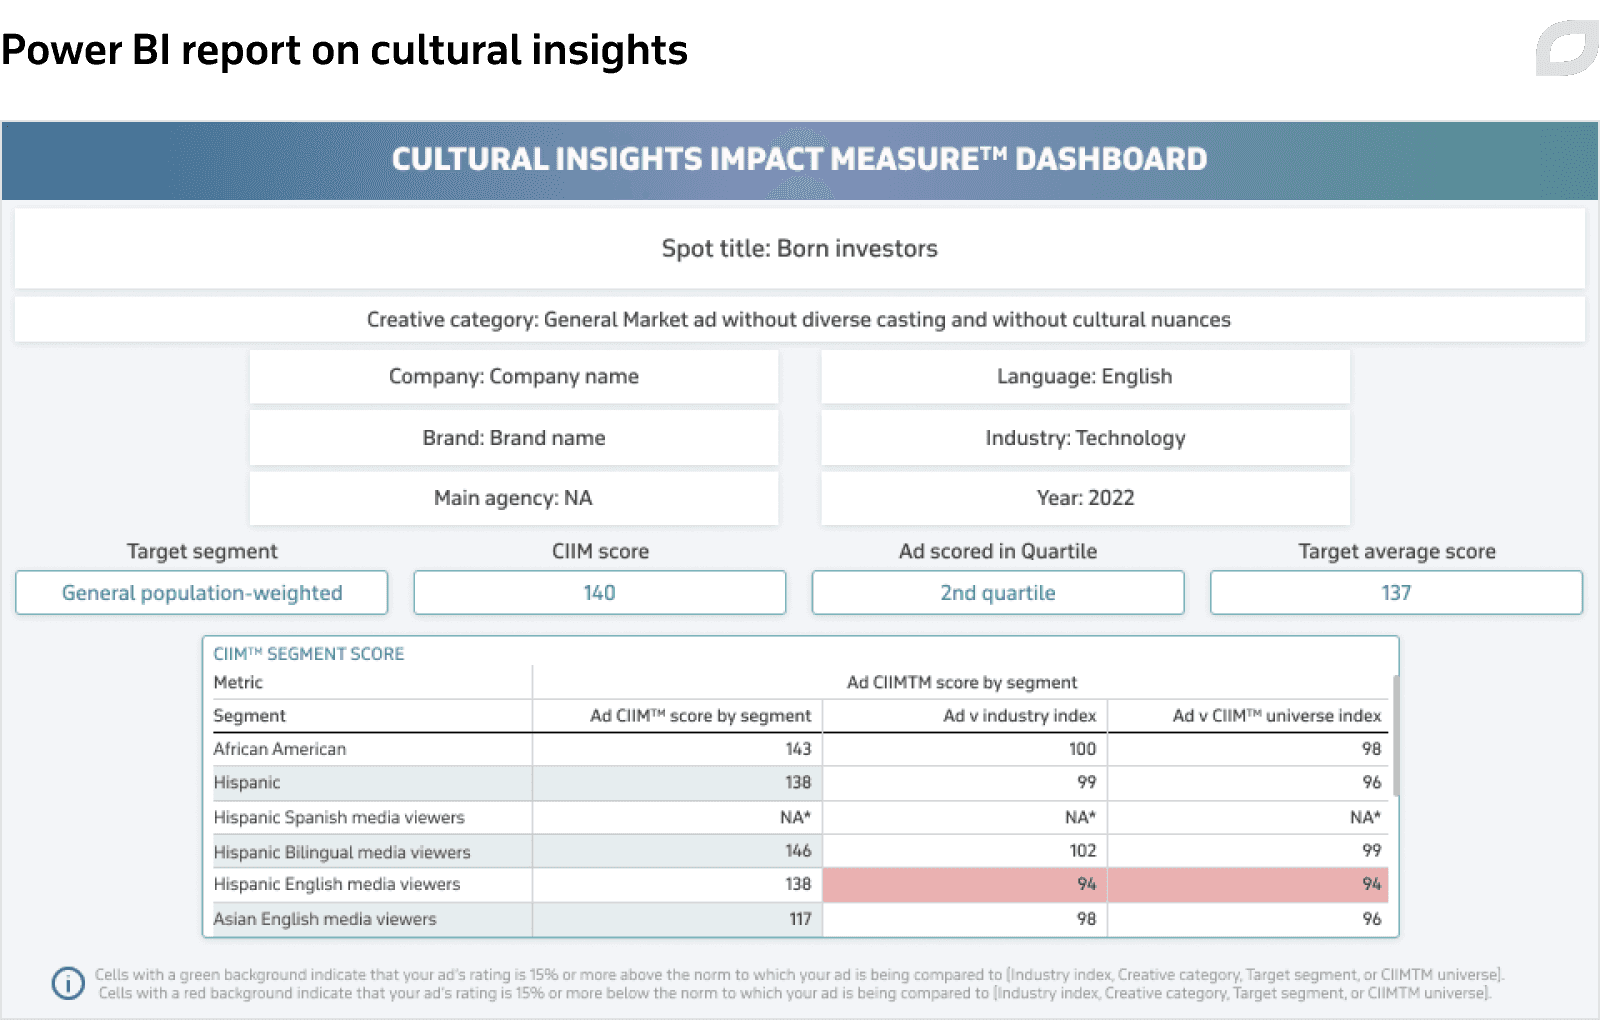
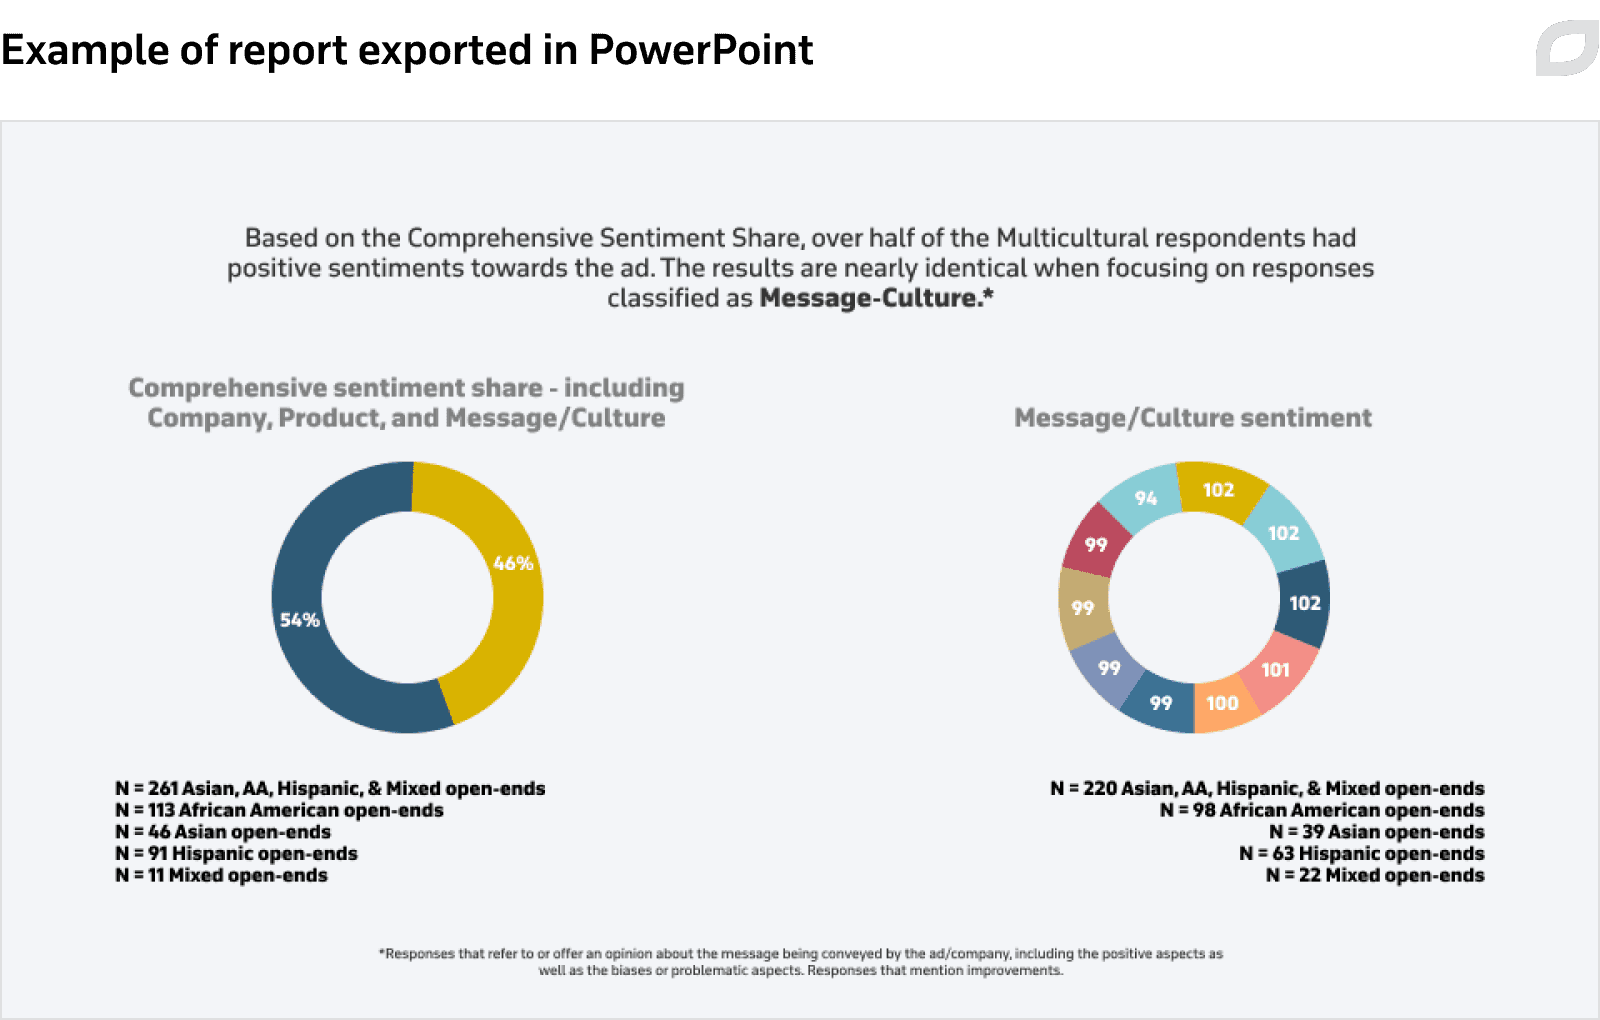
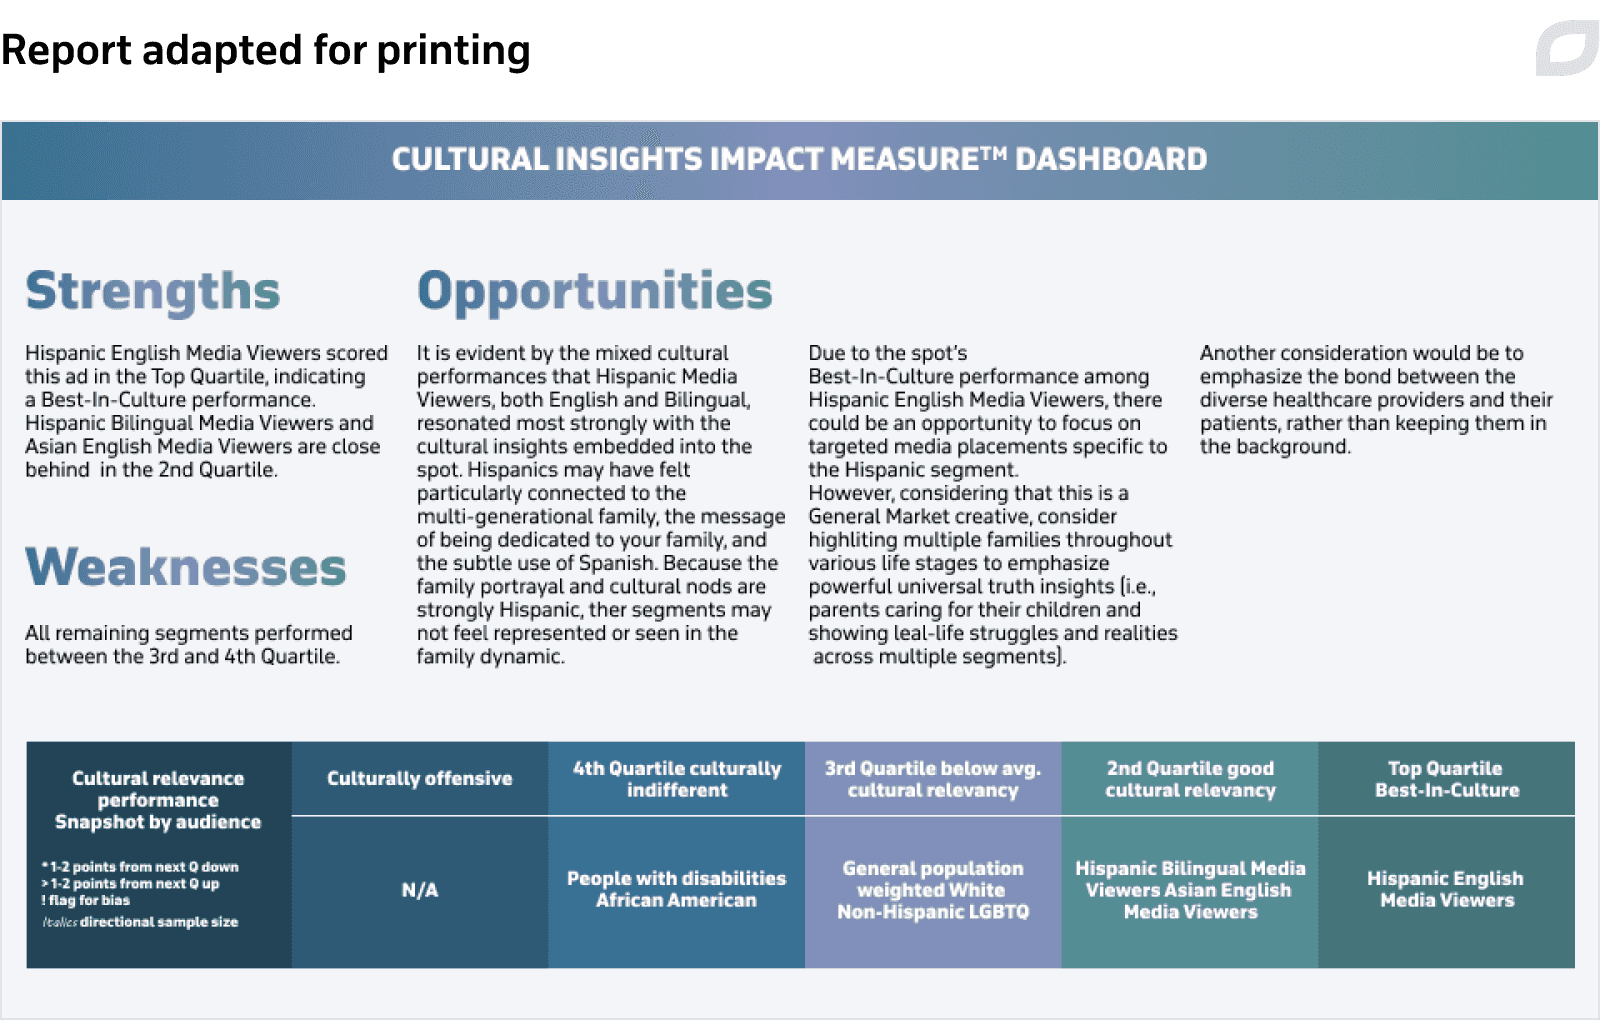
Our specialist designed easily digestible reports that can be exported in PowerPoint and PDF formats and adapted for printing. We also enabled the customer to demonstrate the report visuals generated by Power BI on big screens for their end clients without having to prepare a separate presentation.
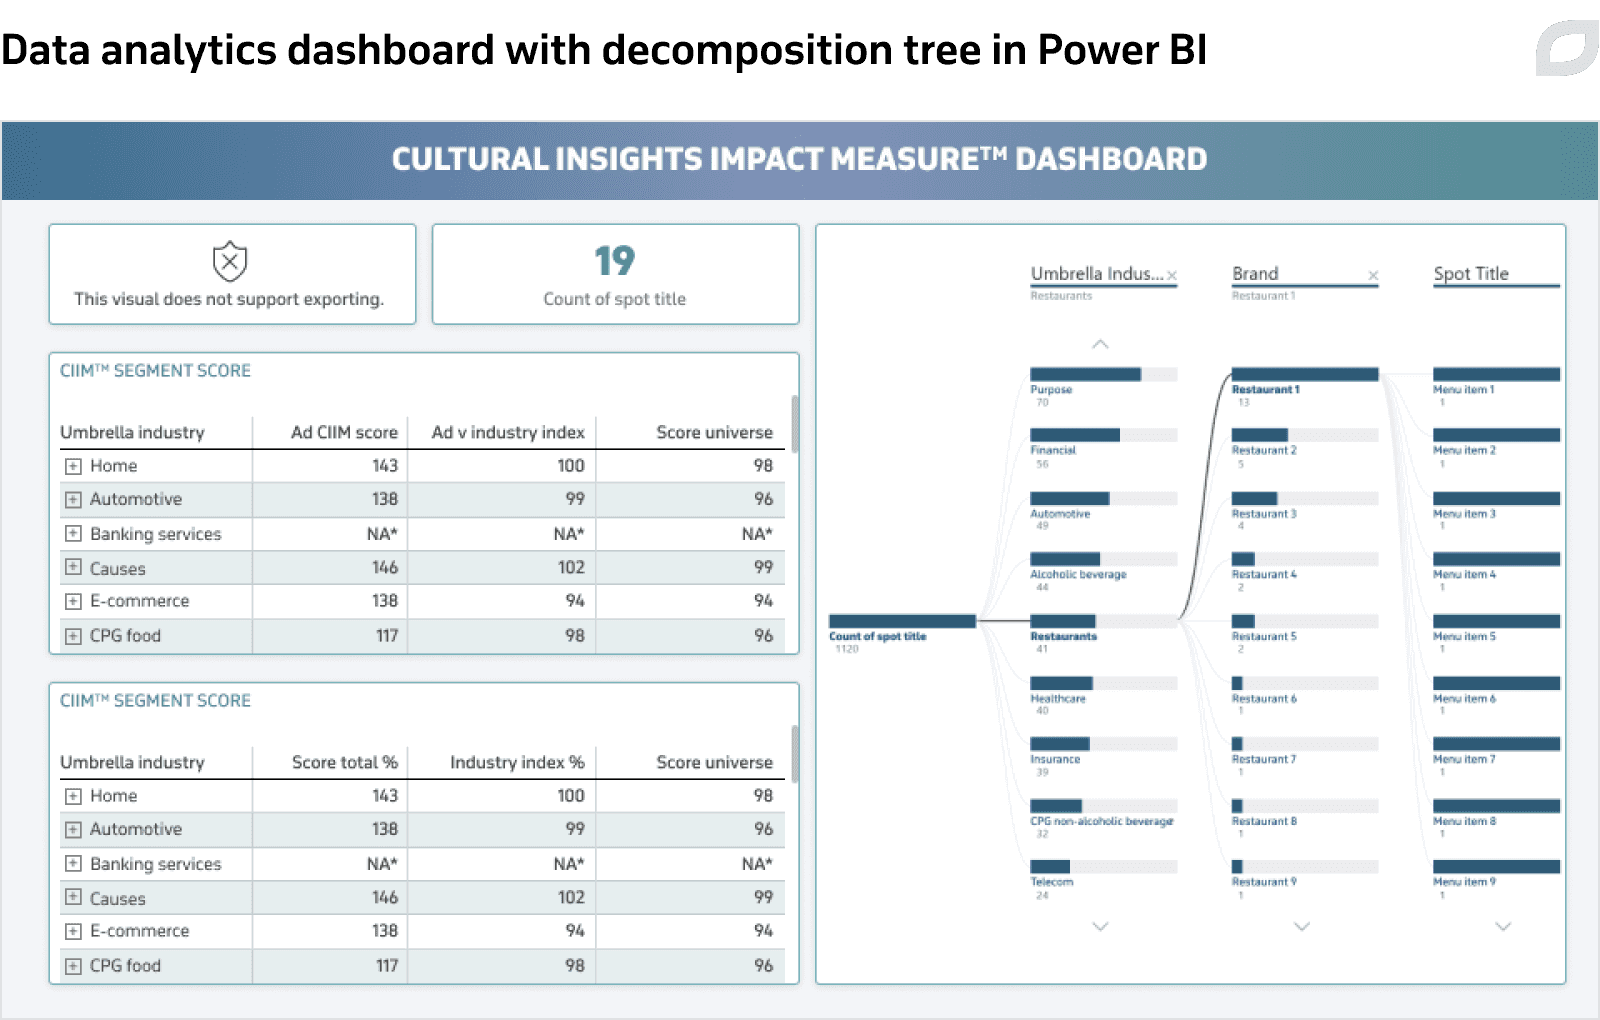
In addition to reporting, Itransition suggested introducing the analytics module. We prepared the design of analytical reports, including filters, diagram types, expand-collapse items, and so on. This module helps the customer deliver ad performance exploratory analysis for their clients to get more actionable insights into their business.
Training
The customer’s team had not worked with Power BI previously, so to help the customer’s employees learn Power BI and get accustomed to it, we conducted user training for marketing data analysts. Our dedicated Power BI specialist prepared a detailed training course and conducted four learning sessions containing all necessary information for the customer’s employees:
- Introduction to Power BI. Data loading and modeling
- Working with Power Query
- Data visualization and filters. Themes configuration
- DAX measures. Formatting for the visualization and tables
During the learning sessions, our specialist demonstrated the Power BI capabilities with the reports based on the customer’s data. Our specialist helped the customer’s employees practice using the new tool so that they could get comfortable with the new workflows. This way, we ensured quicker user adoption.
Results
Itransition helped the customer transform and improve their data processing and presentation. Instead of spending up to a week to analyze their client data and prepare a PowerPoint presentation, the customer’s employees now can at any moment download a Power BI report as a ready-made presentation. If a presentation needs customization for a particular client, the customer can get it done within a day.
Having completed our training course, the customer continued working with Power BI and has already sped up their project delivery two times.

Services
BI services & solutions
Itransition provides end-to-end BI services, enabling companies to unlock valuable insights from their data and make informed, smarter business decisions.

Services
Data analytics services
Rely on Itransition's data analytics services to turn your data assets into business insights and streamline your decision-making.

Case study
An ML solution for brand analytics and reporting
Find out how Itransition’s team designed and developed an ML tool for brand tracking and analytics that processes images 50% faster than the legacy solution.

Case study
BI for incident management
Read how Itransition developed a customizable incident analytics BI solution for a global risk management and safety assurance company.

Insights
Self-service BI: use cases, features & platforms to consider
Explore the concept of self-service business intelligence, key software features and benefits, as well as self-service BI challenges and how to overcome them.

Case study
Benchmark dashboards for ad campaign optimization
Find out how Itransition developed a set of analytics optimization solutions for monitoring ad campaigns and accurately forecasting their results.

Insights
Business intelligence architecture: key components, benefits & tools
Learn about the components of BI architecture and their contents. Explore top software to implement BI architecture and how to overcome its adoption challenges.

Case study
Dedicated team for investment portfolio management ecosystem
Learn how we developed a suite of investment portfolio management tools and custom algorithms now used by thousands of investors.